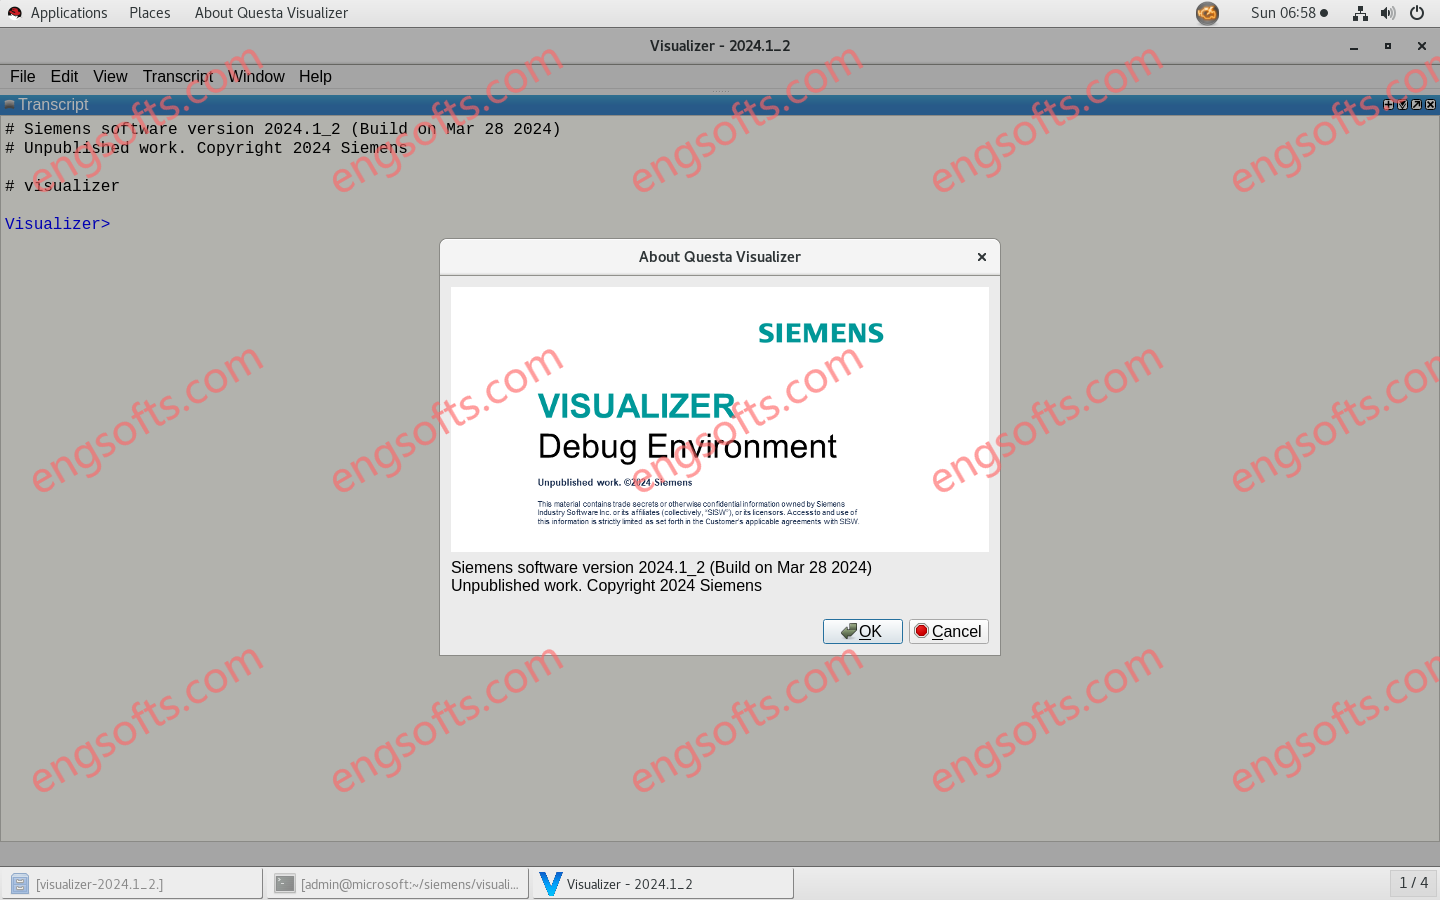
Questa Visualizer Debug Environment is SystemVerilog class-based and UVM-aware to speed up overall debug time, even on today’s most complex SoCs and FPGAs.
Siemens Questa Visualizer Debug Environment 2024.1_2 Linux Tested Picture
The changing landscape of debug
For years the process of ASIC and FPGA design and verification debug consisted primarily of comprehending the structure and source code of the design with waveforms showing activity over time, based on testbench stimulus. Today, functional verification is exponentially complex with the emergence of new layers of design requirements (beyond basic functionality) that did not exist years ago; for example, clocking requirements, security requirements, safety requirements, and requirements associated with hardware-software interactions. Given these complex interactions, effective debug often demands experts that are familiar with all of the components and a debug environment that is aware of these heterogeneous requirements. According to the 2018 Wilson Research Group Verification study, design and verification engineers now spend almost 40% of their overall project time debugging — and that percentage is growing.
Addressing the debug challenge
Questa Visualizer is a context-aware debug platform that supports a complete logic verification flow, including simulation, emulation, and prototyping as well as design, testbench, low-power, and assertion analysis. Visualizer provides a high performance/high capacity debugger that scales from simulation to emulation. Multiple automated features quickly find RTL, gate-level, and protocol bugs. Low- power and UPF debug is fully integrated and overlaid with RTL views.
Intuitive user interface with powerful design debug features
On top of this intuitive foundation, there are powerful features that elucidate the design and its functionality. These include a time cone view, which automates the tracing and visualization of the cause of an event (such as an X) back to its source through multiple clocks, and biometric search, an easy way to search and highlight where a particular value occurs throughout the design.
Unified debug for simulation/emulation
Visualizer delivers high-performance debug through its integration with Questa simulation and Veloce emulation. Visualizer seamlessly merges UVM data from Questa and design data from Veloce in a single debug cockpit. All advanced debug features (e.g., power) are common across both engines. In addition, Visualizer has an on-demand, incremental design and waveform loading capability so only the required modules, hierarchies, and waveform data for a specified duration of time are loaded. Thus, the debug environment can be dynamically scaled to handle the very large datasets typical in emulation while presenting data on-demand and maintaining very fast start-up times. Integration with Veloce also supports viewing annotation and browsing paths of synthesized logic in the context of the RTL design environment.
State-of-the-art testbench debug
Modern testbenches using the UVM class-based methodology require a debug approach that’s more like that found in software development, rather than the time-based RTL and gate- level debug traditionally done by ASIC and FPGA designers. Visualizer offers unique capabilities to view and debug dynamic class member variables alongside DUT signal values in post-simulation and live simulation modes. The hierarchy browser supports full display of the UVM component hierarchy and enables navigation through the source code with full annotation, so users can easily see testbench values in time. The UVM schematic shows testbench connectivity and the interfaces connecting to the DUT. Visualizer understands and simplifies the underlying UVM internal architecture by presenting just the vital information filtered from the UVM environment.

