Petrosys is the leader in mapping, modeling and data management solutions for the oil & gas industry – uniquely integrated with the broadest range of specialist geoscience and GIS applications. Petrosys produces quality maps and visualizations. It aggregates, manages and analyzes the underlying data – for actionable results that communicate with clarity and accuracy. Petrosys is the industry leader in mapping, surface modeling and data management software solutions – delivering direct connectivity with the E&P industry’s most popular exploration, production and GIS data sources. Petrosys produces high quality maps and surface models. It manages, edits, and analyses the underlying information including the specialised seismic, well and geoscience data used in the search for oil and gas. Geoscientists, data managers and engineers at more than 300 sites worldwide use Petrosys software as an essential tool for basin and field interpretation, to enhance enterprise data management and to help make better decisions.

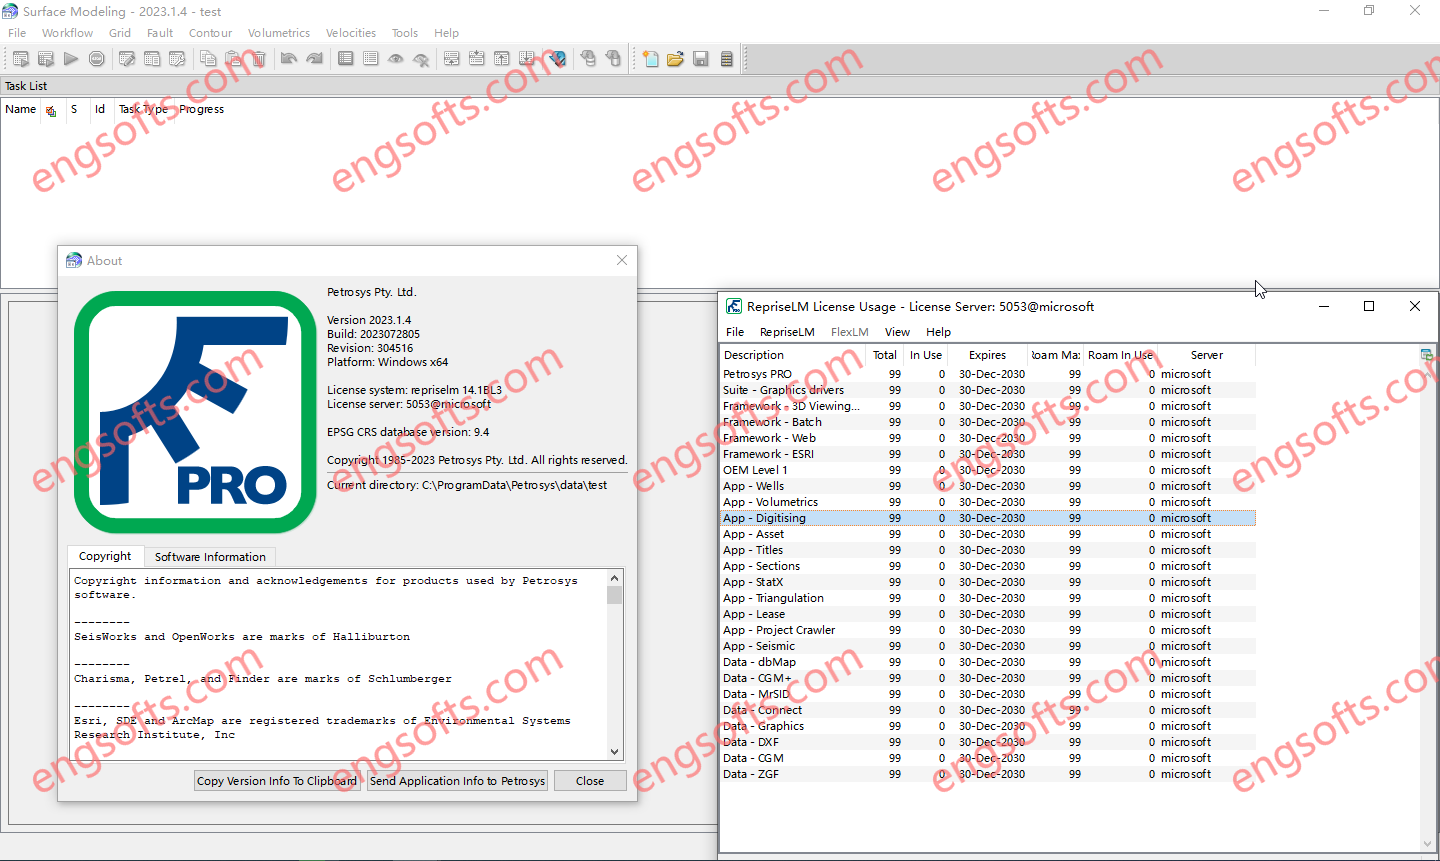
Petrosys PRO 2023.1.4 Tested Picture
RELEASE NOTES 2023:
Petrosys PRO 2023.1.4 takes visualization to the next level with a completely new X Section module and a Fault Statistics module.Building on the strong collection of innovative and improved features in the PRO 2021 series across Connectivity, Mapping & Visualisation and Surface Modeling, Petrosys PRO 2023.1.4 delivers the latest functionality whilst the enhanced development of existing features continues to add value to our client’s software investment.
Highlights
X Section application: the next step in advanced visualisation making it easier for you to understand the relationships in your structure and achieve an accurate representation of the subsurface.
· Fast and Easy: Create a line of section from an existing Petrosys PRO map.
· More Powerful than Ever: View surfaces in the cross section before & after editing and re-gridding.
· All your Data in One Place: Display data from 3rd party vendors and compare in cross section.
Fault Statistics: development driven by customer feedback the new tool gives users access to plotting capabilities, thematic mapping, editing functionality, rose diagrams and much more.

 ID:956575828
Must log in before commenting!
Sign Up