The DecisionTools Suite is an integrated set of quantitative data analysis programs that remove uncertainty in decision-making through probabilistic risk analysis using Monte Carlo simulation. Create decision trees, optimize resource allocation, identify critical factors, manage uncertainty in project schedules, and more when you install the toolkit into the familiar environment of Microsoft Excel.

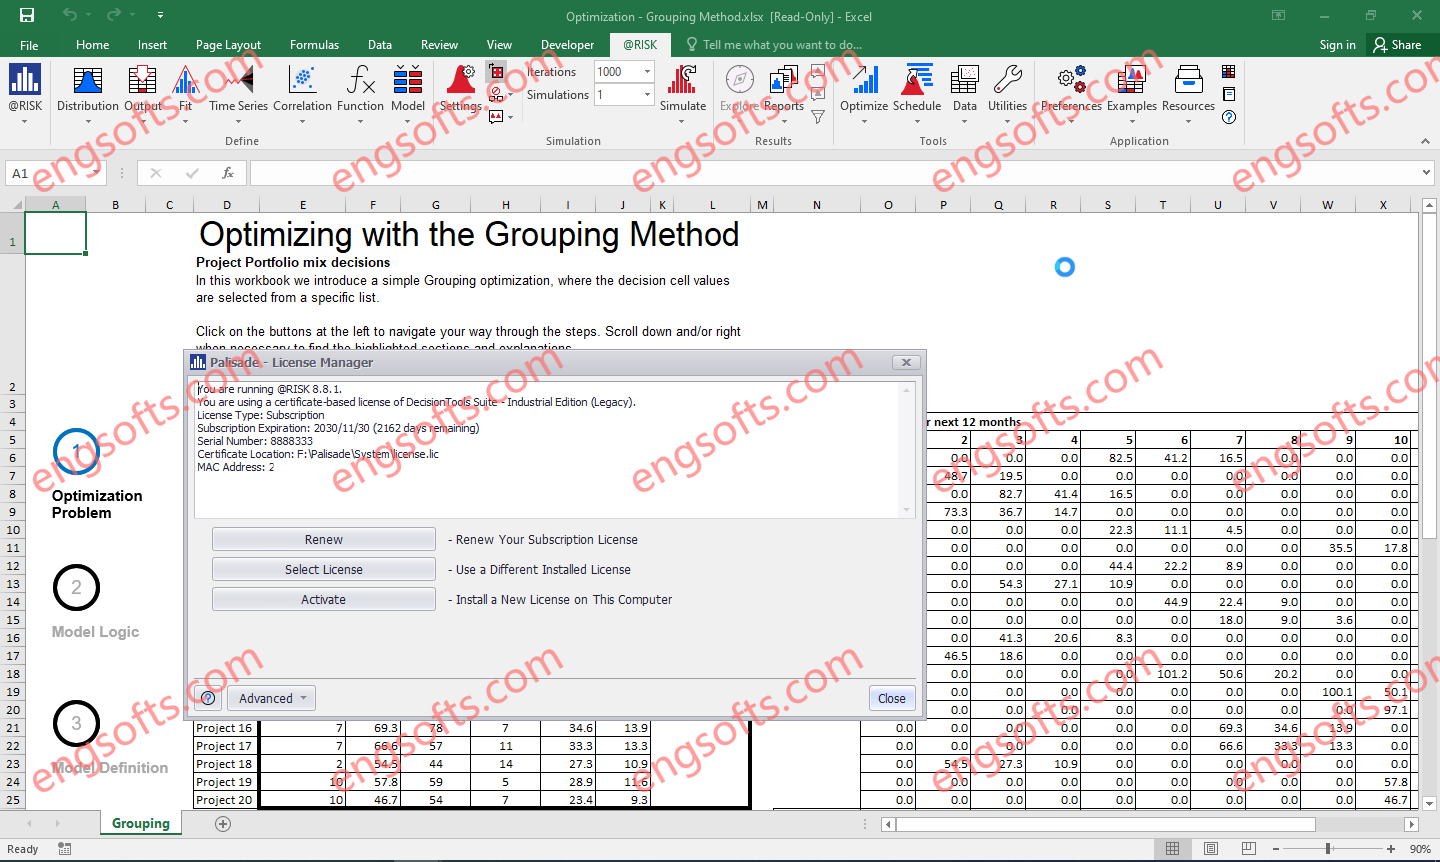
Palisade Risk Platform (DecisionTools Suite) 2024 v8.8.1 Tested Picture
@RISK – Model Risks, Uncover Opportunities
@RISK performs risk analysis using Monte Carlo simulation to show you many possible outcomes in your Microsoft Excel spreadsheet — and how likely they are to occur. This means you can judge which risks to take and which to avoid.
PrecisionTree – Visualize Different Outcomes
PrecisionTree performs decision analysis in Microsoft Excel using decision trees and influence diagrams. Decision trees let you visually map out complex decisions in a sequential, organized manner. This helps you identify all possible alternatives and choose the best option.
TopRank – Identify Critical Factors
TopRank performs automated “what if” sensitivity analysis on Microsoft Excel spreadsheets. Define any output or “bottom line” cell or cells, and TopRank will automatically find and vary all input cells which affect your output. This allows you to identify and rank all input factors which affect your bottom line.
NeuralTools – Make Intelligent Predictions
NeuralTools performs predictions in Microsoft Excel using sophisticated neural networks. NeuralTools imitates brain functions to “learn” patterns in your known data, using those patterns to make predictions from new, incomplete data. NeuralTools can automatically update predictions when input data changes, saving time and enabling more robust analyses.
StatTools – Leverage Data for Forecasting
StatTools performs forecasting and statistical analysis in Microsoft Excel. It replaces Excel’s built-in statistics functions with its own more robust and accurate functions. StatTools covers the most common statistical analyses but also allows you to build custom statistical procedures.
Evolver – Solve Complex Allocation Problems
Evolver performs optimization in Microsoft Excel using genetic algorithms, linear programming, or the OptQuest solving methods. It finds the best solution to linear problems large and small and gives the best overall global solution to nonlinear, complex problems where other solvers fail. Evolver constantly tries new, different solutions to arrive at the best answer possible.
RISKOptimizer – Optimization with Monte Carlo Simulation
RISKOptimizer uses genetic algorithms or OptQuest methods, along with Monte Carlo simulation, to solve optimization problems. Take any optimization problem and replace uncertain values with @RISK functions representing ranges of possible values. RISKOptimizer tries different combinations of adjustable cells to achieve your goal while running Monte Carlo simulations on each trial solution to account for inherent uncertainty. The result is the most robust, accurate solution possible.
ScheduleRiskAnalysis – Manage Uncertainty in Project Schedules
ScheduleRiskAnalysis analyzes schedule risk using Monte Carlo simulation with @RISK. This means SRA shows you virtually all possible outcomes in your schedule – and tells you how likely each is to occur. SRA helps you judge which risks to take, and which ones to avoid. SRA also ranks your risks, enabling you to identify the variables which impact your schedule the most.

